The United States Department of Agriculture recently announced changes to its Plant Hardiness Zone Map and to its website. This is big news for gardeners.
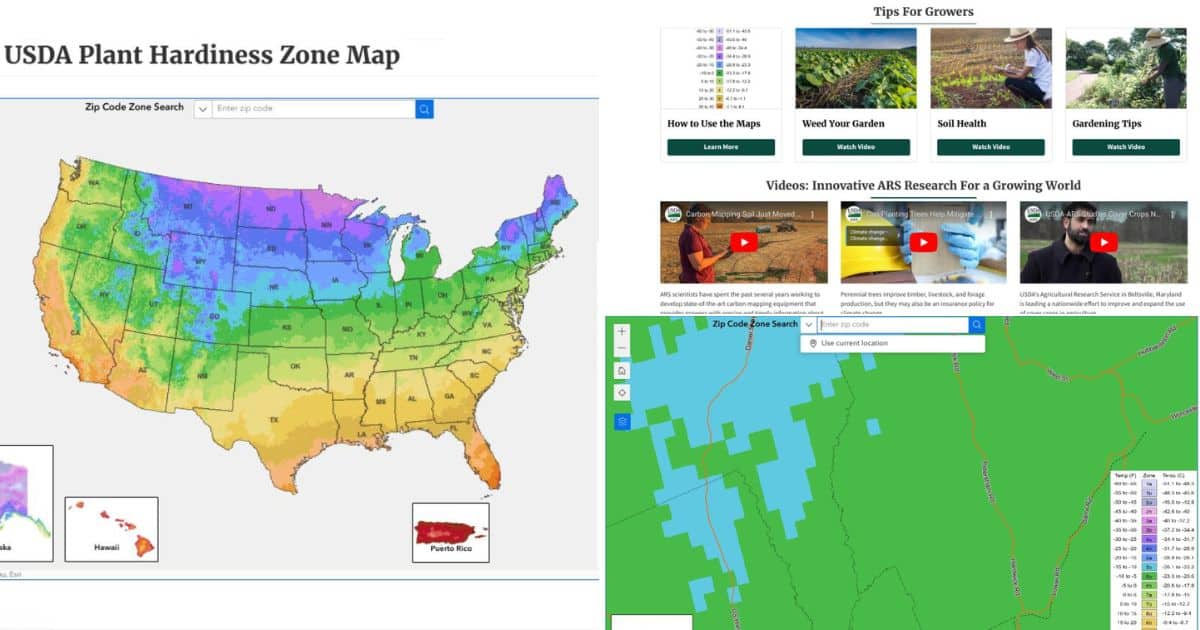
Changes to the USDA zone map don’t happen that often, and they don’t happen on a set schedule. The map is updated roughly every decade or so, but the timing varies.
When changes are made, you’ll want to know about them if you live in a location that is covered by the USDA zones or if you use information based on the zones. (Zones are temperature ranges, so it’s easy to compare your information to the zones to figure out how information or plant hardiness applies where you are, even if you don’t live in the U.S. or its territories.)
Jump to:
The Big Questions Growers Want Answered About USDA Hardiness Zones
The big questions everyone will be asking are,
What’s new with USDA hardiness zones? And,
Did my plant zone change?
Let’s take a look and find out what’s new and what isn’t:
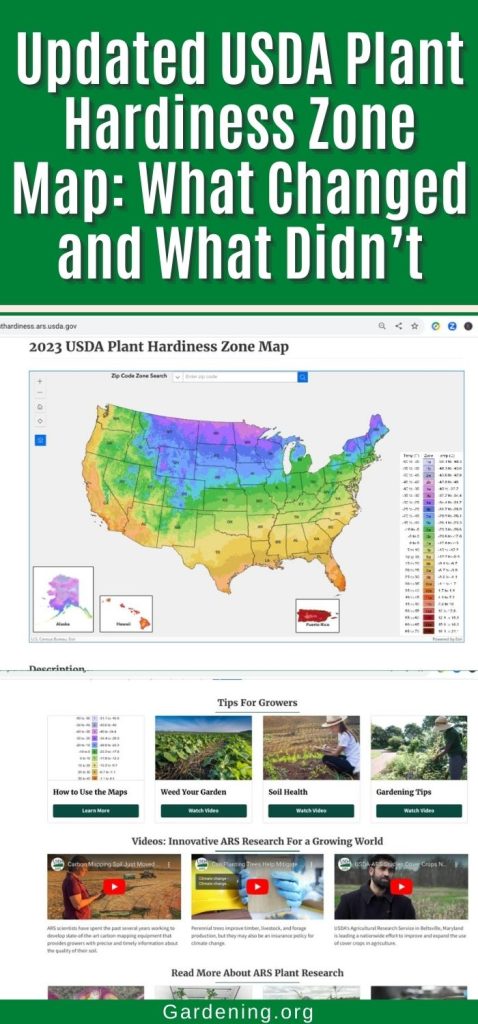
What’s New and What Isn’t on the 2023 USDA Plant Hardiness Map
Let’s start with what did not change with this map and with this update. That might give you an idea of how important this plant zone update is to you.
What didn’t change with this plant zone update?
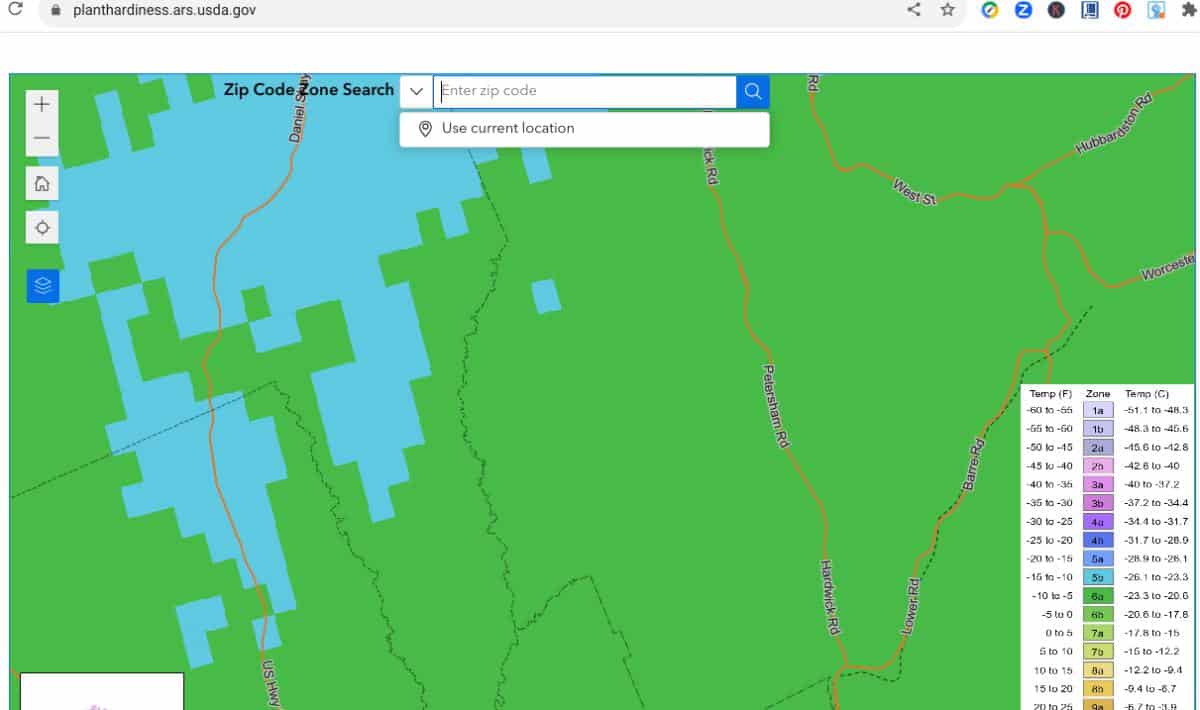
- The number of zones did not change
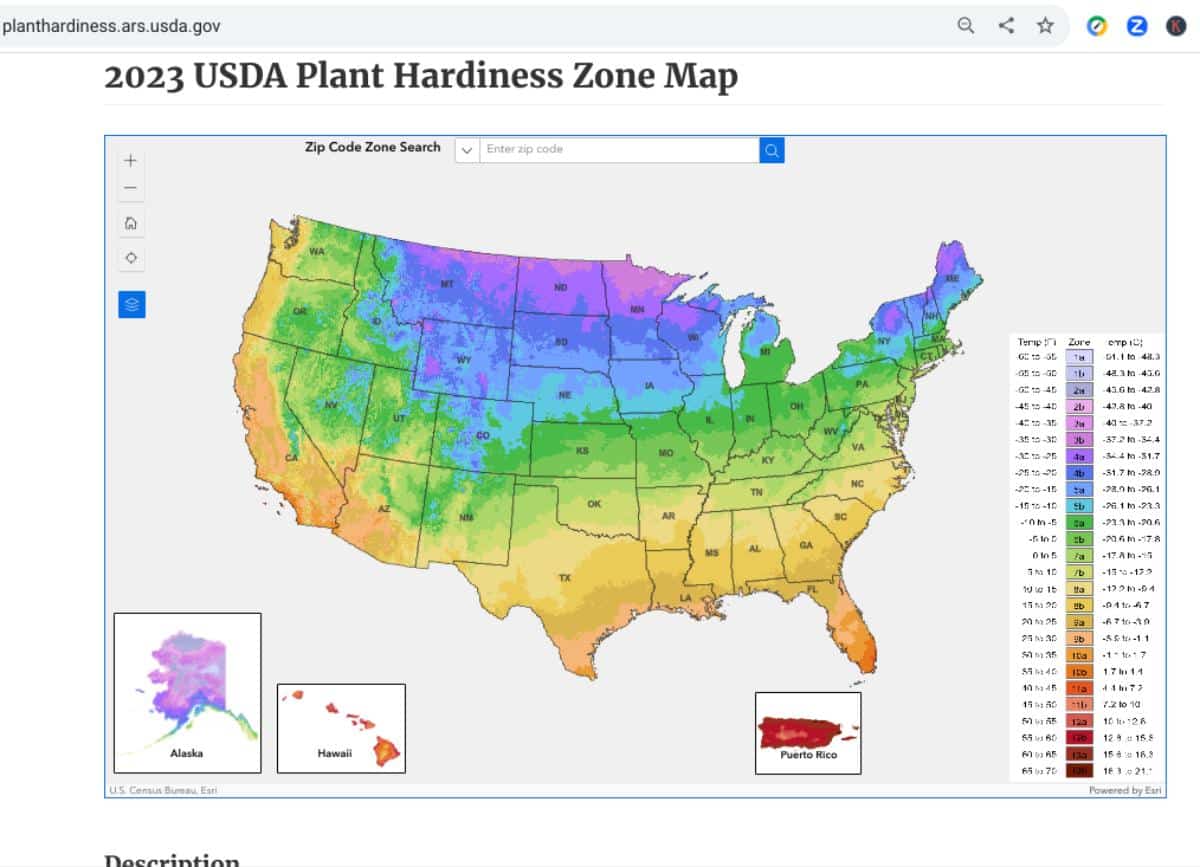
- There are still 13 growing zones on the map
- The 13 zones are still broken down into half zones for more specific plant hardiness information
- Half zones are still labeled as “a” or” b”, such as Zone 5a or Zone 5b
- The temperature range used for each zone is the same
- Zones are still based on 10-degree (Fahrenheit) ranges
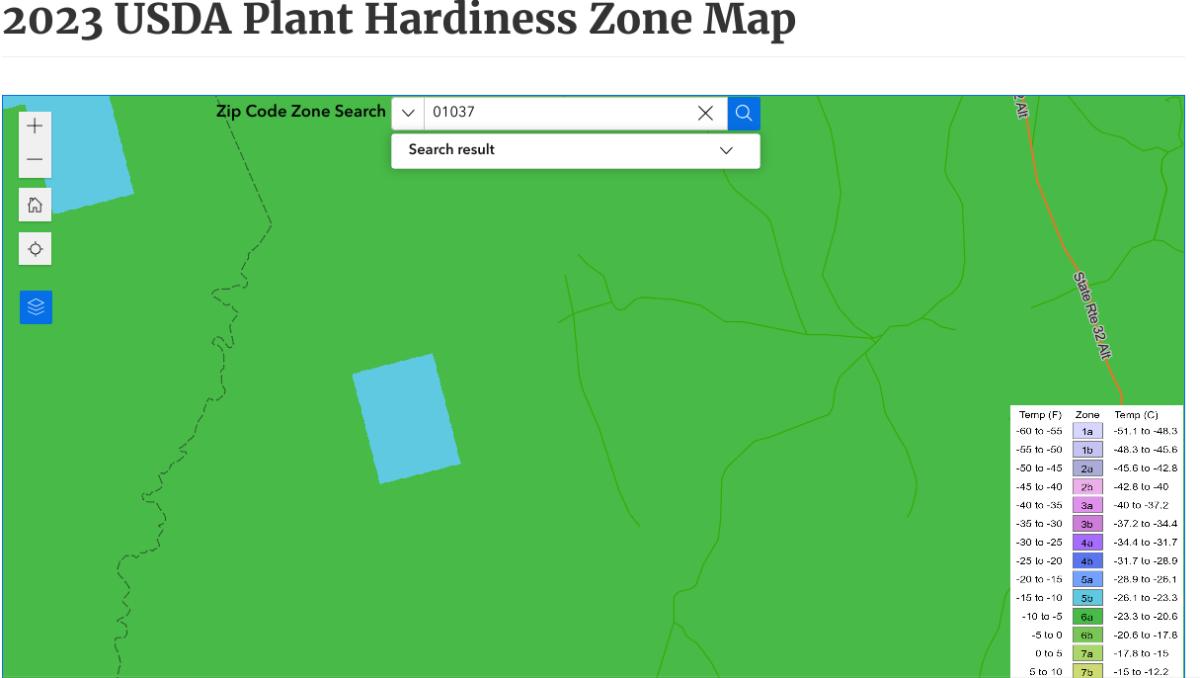
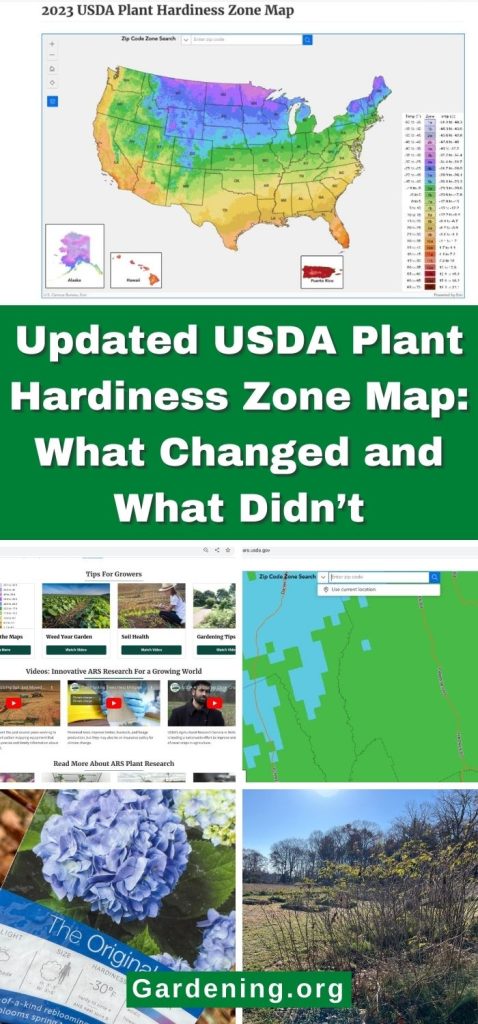
- The interactive map is still GIS-based, allowing you to locate your specific town by zip code and to zoom in further to find your street and location
- With the interactive GIS Hardiness zone map, you can add layers and zoom down to very specific locations
- Zooming in sometimes reveals pockets where a zone may be higher or lower, surrounded by a larger zone
- The zones are still determined by averaging out a location’s extreme low or minimum temperature
- As before, it is possible for a zone to go lower than its average, but that is not the norm
What’s new about this USDA hardiness zone update?
Here are some key changes:
- The zone assigned to your location may have changed
- The USDA reports that about half of the locations shifted by one-half zone
- Most zone changes were one-half zone warmer
- Some locations warmed somewhat, but not enough to make a change in their hardiness zone assignment (in other words, less than five degrees Fahrenheit)
- About half of the locations did not change at all in their zone assignment
- The USDA says that the new map includes more detail and is more accurate
- It is more locally specific
- They note that the map for Alaska is now at a much higher resolution and is now down to one-quarter mile in detail (a refinement down from 6.25 miles of detail in 2012)
Plant Hardiness Website Gets an Upgrade, Too
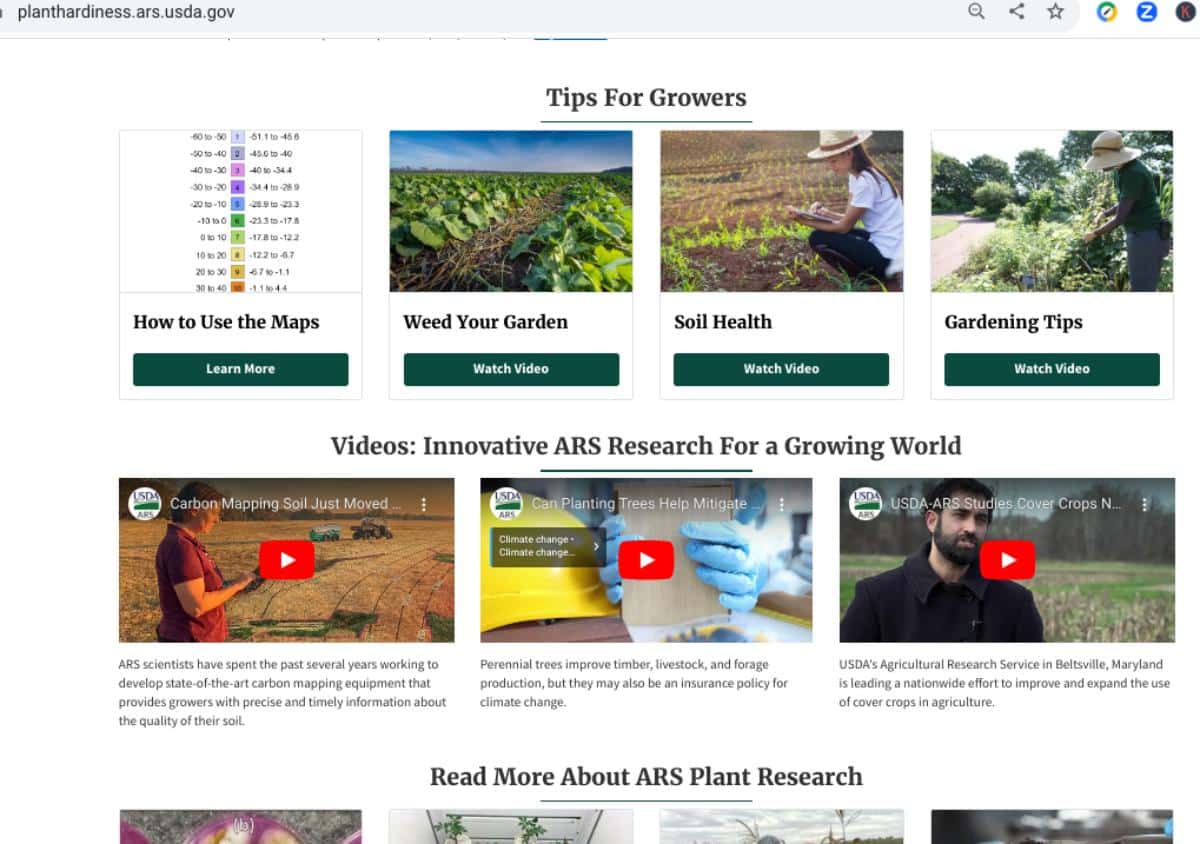
The website for the Plant Hardiness Zone has been updated, too, and now includes an information section called “Tips for Growers”.
This includes videos and various tips and information for gardeners and growers. Topics include things like general gardening tips, weeding your garden, and soil health.
It also includes a section on ongoing research with videos detailing different research projects relating to climate, plants, and agriculture. Some topics covered here are carbon mapping, cover cropping, and how trees can protect us against climate change.
Other Interesting Things to Know About the 2023 USDA Zone Map Update
- The number of data stations used to collect the weather data has almost doubled, making the information more accurate and refined to more specific locations
- The 2012 update used information from 7983 weather stations
- The 2023 update used information from 13,412 stations
- The map is based on 30 years of extreme low-temperature averages
- The previous map was also based on 30 years of averages from 1976 to 2005
- Prior to that, different time periods were used, and the map before the 2012 map was only based on about 12 years data
- The yearly “extreme minimum temperature” used in the average is taken from the coldest night of the year
- The USDA points out that warmer averages and new assignments to warmer zones do not necessarily reflect global warming or global climate change
- Many of the “warming” results are because there are so many more weather data stations reporting and because mapping and technology have improved to be more specific and more localized
- It has been decided that a longer period on which to average temperatures and base zones is more accurate
- Longer periods of averaging smooth out peaks and valleys caused by a fluke warm or cold year
- Using data from a more recent period of time has contributed to zone assignment changes, too
Fun Facts Beyond Plant Hardiness
- Gardeners aren’t the only people who use the USDA zone map and data
- The map is frequently used as a basis for setting crop insurance criteria by the USDA Risk Management Agency
- Researchers use the map for such projects as modeling and predicting the spread of non-native weeds and insects
- Though it is always referred to (and is) the USDA’s Plant Hardiness Map, the project is a joint endeavor, and the map is developed in partnership between the United States Department of Agriculture’s Agricultural Research Service (or ARS) and Oregon State University’s PRISM Climate Group
You can access, download, and print the new 2023 USDA Hardiness Zone Map here. It is free to use and distribute. It is likely only to make a minor impact on your gardening life, but is interesting just the same, and the information you can glean from it is useful in planning perennial gardens and permanent landscape, tree, and orchard plantings.


Rosefiend Cordell
According to the previous map, I was in zone 5a, but I'm pretty sure that we've been solidly in zone 6 for a good 5 years, and the new map reflects that. I hope they consider updating this map more often because zone changes are moving faster than any of us would like.
Mary Ward
They are probably unlikely to speed up the frequency of updates, and the reason is that they want a long span of time that they believe is more reliable. The last two updates were on 30 years of data but before that it was only 12, which meant that a year with unusual temperatures was emphasized too much in the averaging. Longer periods smooth out the impact of the odd freak year or two.